We offer OEM versions and single-user licences.
WP-OPT EN
• Selection of the heat pump • Calculation of the annual performance factor with simulation with hourly climate data • Hot water preparation • Cascades and back-calculation from consumption • CO2 emissions report • Step by step calculation •
Estimate economic feasibility of your investment
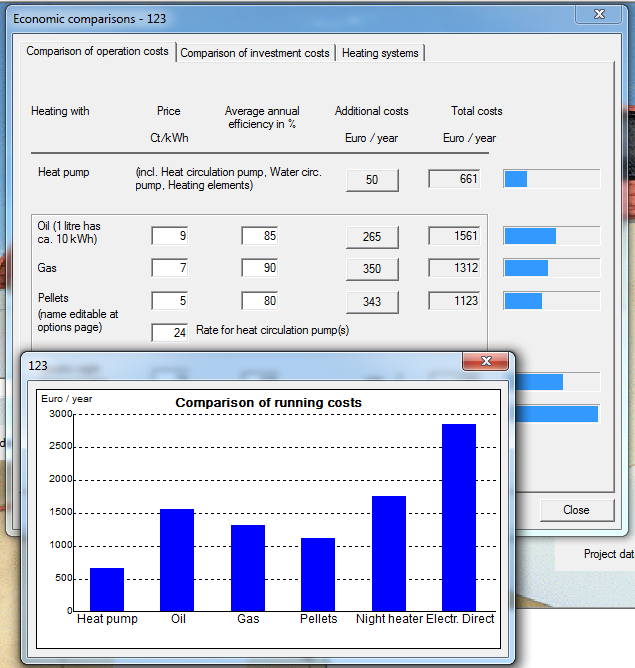
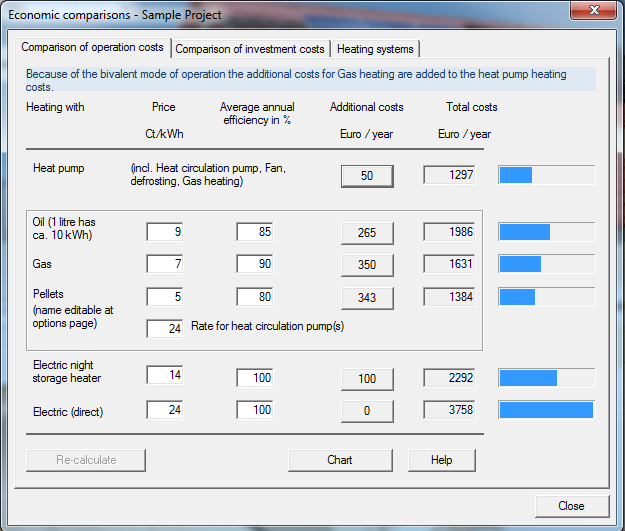
Going for heat pumps is normally a big investment, but will pay off in the long-run, provided that it’s wisely selected. We can show how this investment works out in the future, so you can also convince your customers in a scientific manner with enough statistics and data on how their money will return in the long term. Furthermore you can make changes to some parameters to see how it will affect the results in the long-run. It helps you to fine tune the factors, rates, tariffs and values so you get the most out of the heat pump. You can then show different scenarios with corresponding results (both in form of numbers or charts) to your customers to let them freely decide on how they like it to be implemented.
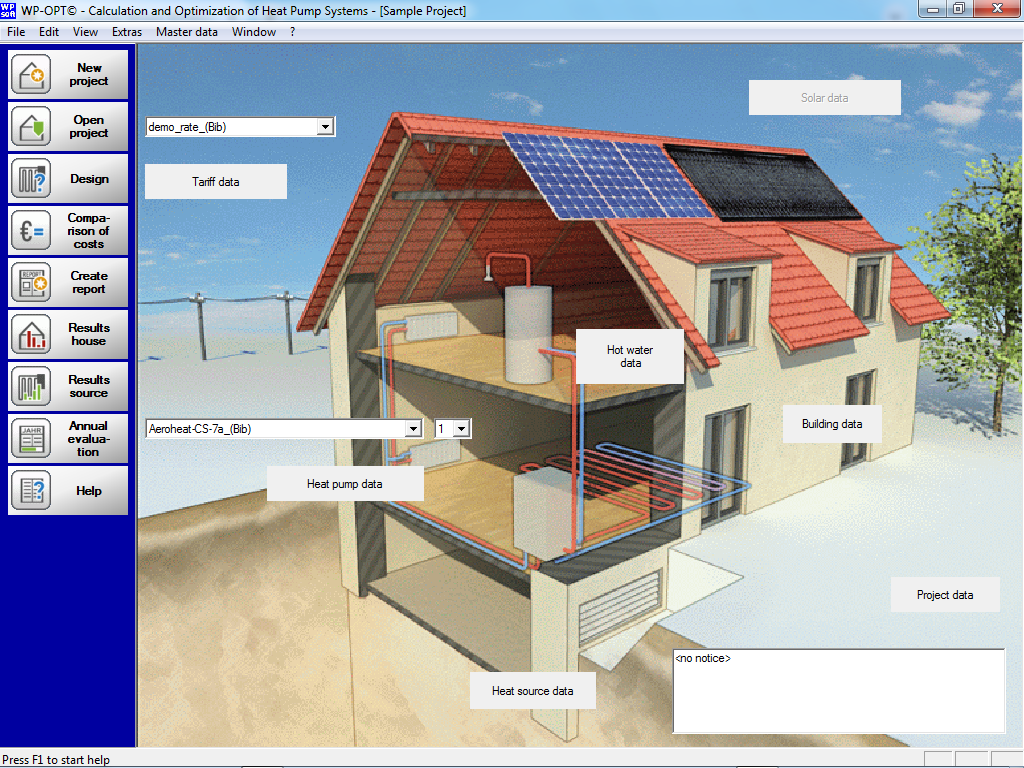
Intuitive user interface
In order to make the data entry easier for you, we’ve made the whole system schematic, so that you can simply go to the correct part to view, edit or add the respective data. We have made solar, tariff, hot water, building, heat source, heat pump and the whole project visually highlighted. Also on the left side of the application, there is a sidebar containing menus for accessing main functionalities of the application. All windows have a help button available to offer you with necessary instructions in case you’re in doubt about anything.
create custom reports in your country language
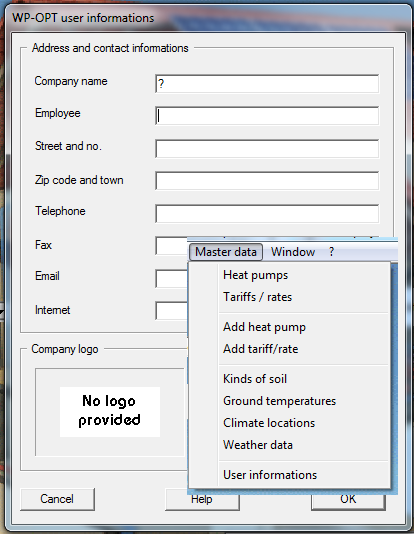
If you want to present the results of calculations to customer, or if you plan to store them for later use, then we’ve got you covered. All you need is easily available under the reporting menu: a report generator is available to provide you with a custom built report containing all needed information. You can specify which data you want to be included in the report and also how you want it to look like. If you’re going to prepare a report for your customers, you can also set your logo, enter your name and contact info, and then the generated report will be made quickly as a Word file.
WP-OPT is customisable for your projects
Although the application covers an already extensive built-in database, you can add your own heat pumps, edit tariffs/rates, ground temperatures, weather data, kinds of soil to make the program work according to your specified region. This way, even if you have customers from regions not listed in the application, you will still be able to use it, you just need to add the data of that specific location. The more accurate the data, the more reliable the results will be.
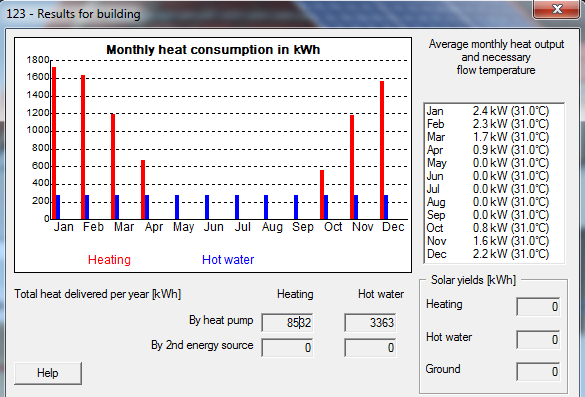
Results for building DIALOG
Results for building dialog box delivers information, categorized in 4 parts. This bar chart shows the monthly heat consumption for heating and hot water with different colors (which can be changed in Options menu). The section “average monthly heat output” lists the average momentary heat wattage of the building system for every month (together with flow temperature in parentheses). The section “Total consumption per year” displays the overall heat consumption for heating and hot water. “Solar yields” section shows the annual sum of solar input for each of the three possible solar energy sinks.
DEMO
FREE
WP-OPT Pro
535 €
OEM Version
Request a quote
Essential features of WP-OPT
Frequently
Asked
Questions
If you have any further questions, please use our contact form.